Help
Nomenclature of genes and transcripts in ALDB
Format: (ALDB)(SSC|GAL|BTA)(G|T)##########ALDB is a prefix.
SSC|GAL|BTA SSC - Sus scrofa; GAL - Gallus gallus; BTA - Bos taurus.
G|T G - gene; T - transcript.
########## a serial number.
e.g. ALDBSSCG0000006702 is the ID of a Sus scrofa gene; ALDBSSCT0000011043 is the ID of a Sus scrofa transcript.
GBrowse
GBrowse greatly facilitate users to browse any region of interest in the pig, chicken and cow genomes. It allows for a comprehensive analysis of the genomic neighborhood of a single gene/transcript. Users can select data source and search transcripts/genes by their ids/names, or by a genomic region. A variety of track features can be accessed depending on the region's position on the genomes, including lncRNA genes, protein-coding genes and QTLs (Figure A). During viewing the features, users can zooms out/in a region to view the outline or details of a feature. If the user holds the cursor over a specified gene/transcript, a popup balloon will appear to show gene tracks, symbols and location information. Alternatively, by clicking on a specific gene, users can jump to a new corresponding gene information page to view its more considerable details (Figure B). Users can view different elements on different tracks by customizing tracks on the page “Select Tracks” (Figure C).
Figure A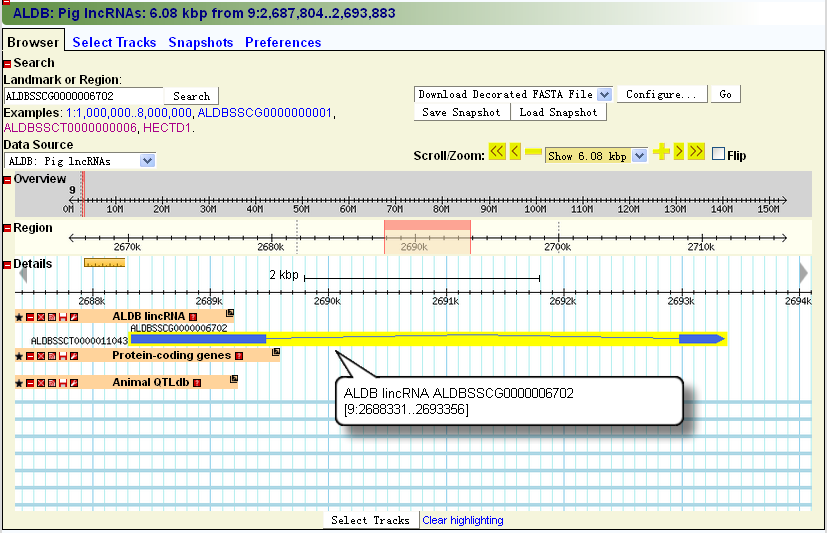
Figure B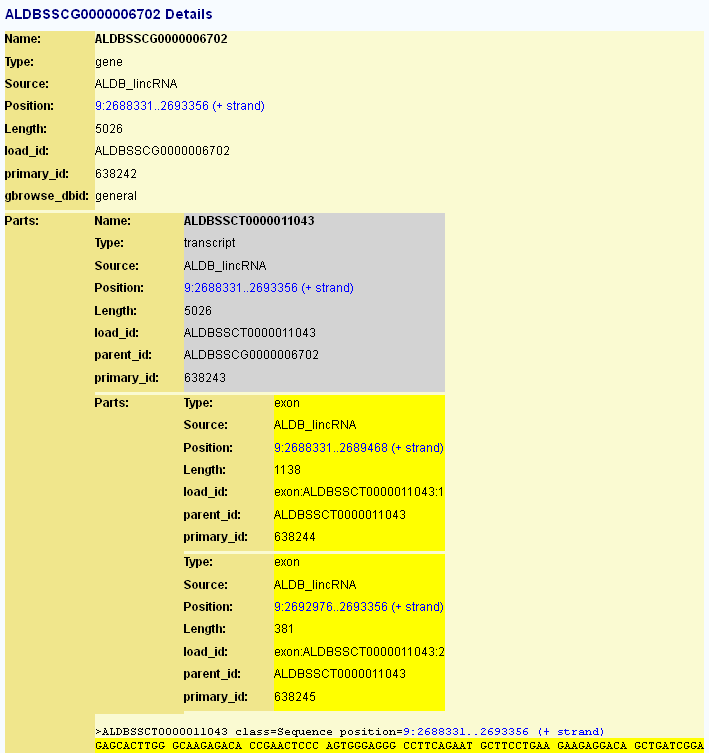
Figure C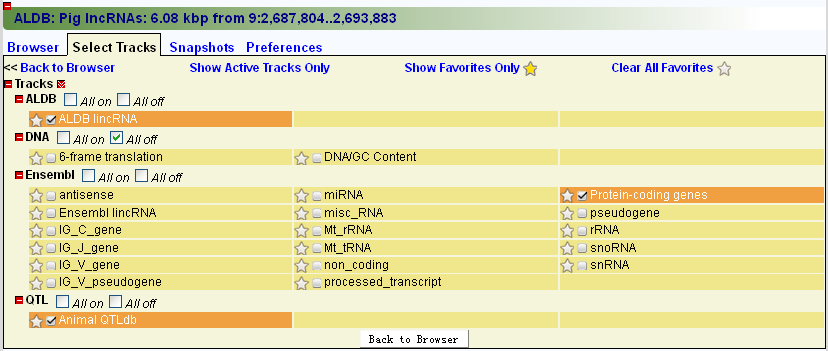
Search
A search function was designed to facilitate users to retrieve useful information, such as the basic information of transcripts and genes, expression profiles, neighboring genes, overlap with QTLs and the lncRNA genes adjacent to a specific protein-coding gene. These functional units are contained in the “Search” section on the main navigation bar. This section mainly includes “Search by Id/Name”, “Search by Genomic Location”, and “Search Neighboring LncRNAs” pages.
In the “Search by Id/Name” page, user can find transcripts and genes by inputting their ids or names (Figure A). For a transcript/gene, the following relative information will be represented: “Basic information” (Figures B, C), “Expression profile” (Figure D), “Neighboring genes” (Figure E), “Overlap with QTLs” (Figure F). The content panels can be expanded or collapsed when their head titles are clicked.
The “Search by Genomic Location” page is designed to help users to retrieve all the genes and transcripts located in a specific genomic region (Figure G). If users are interested in a transcript or gene, they can click its id in the first column to view its details, or click “GBrowse” in the last column to visualize it in GBrowse.
The “Search Neighboring LncRNAs” page can be used to search the lncRNA genes adjacent to a protein-coding gene (Figure H).
Figure A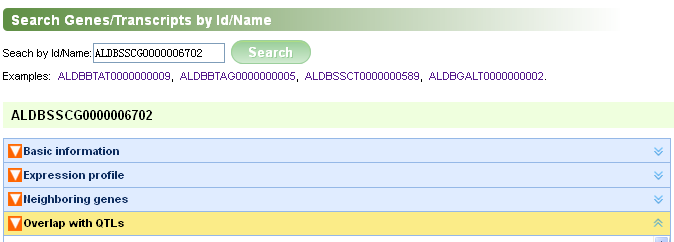
Figure B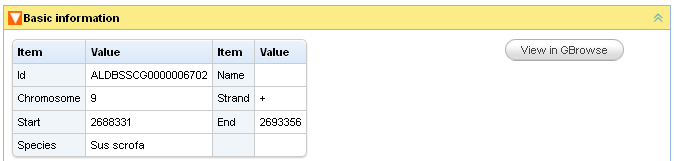
Figure C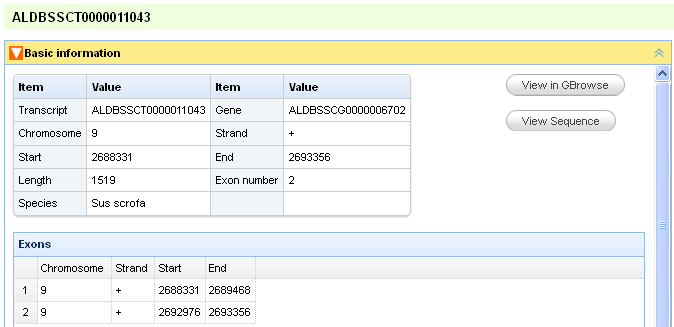
Figure D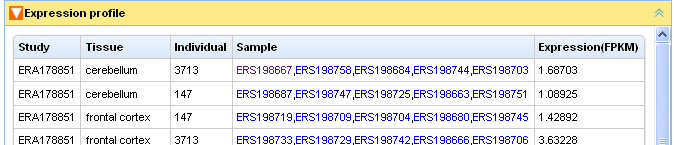
Figure E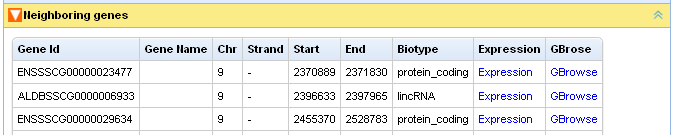
Figure F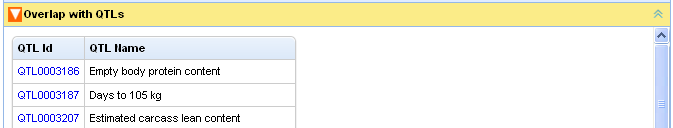
Figure G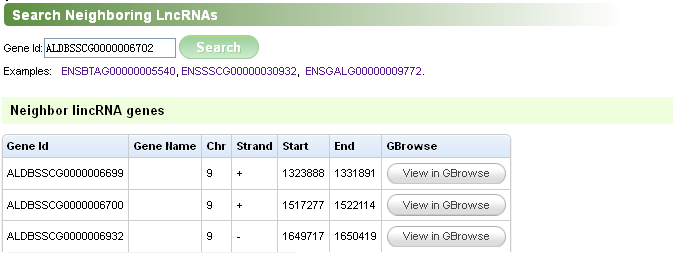
Figure H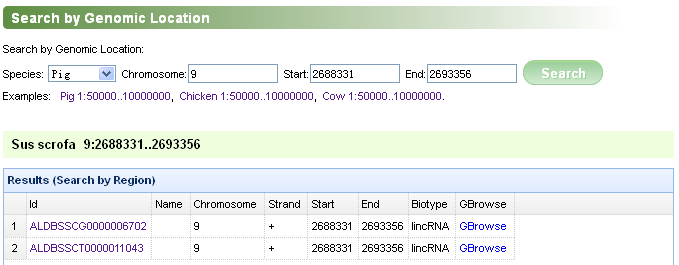
BLAST
Since ALDB maintains nucleotide sequence data of lncRNAs, a sequence alignment tool, called wwwblast, based on the Basic Local Alignment Search Tool (BLAST) is integrated into ALDB. Users can compare a query sequence with a library of lncRNA sequences using a BLAST search, and identify lncRNA sequences that closely resemble the query sequence. BLAST will meet users’ requirements for various interests related to homologous transcripts or genes. On the BLAST page, users can supply one or more query sequences by uploading or directly pasting them to search against the available databases using BLAST's default parameters. Users can also specify more parameters for BLAST search to control the search sensitivity, the result format, etc. The BLAST results will be displayed in another page in the Pairwise format by default.
Analysis
Tissue-specific Expression This page lists the tissue-specific expression genes. For each study, we take
one tissue as CASE tissue, and the rest as CONTROL tissue. The results were derived by using DESeq2 and were
filtered by padj<0.1 (padj<0.1 remained).
Overlap with QTLs (Trait Hierarchy) The trait hierarchies were collected from Animal QTLdb. We list the numbers of genes which overlap with these traits.
The numbers in the square brackets indicate the number of tissue-specific expression genes.
Overlap with QTLs (by Trait) Users can search/list genes by a Trait ID.
Overlap with QTLs (by QTL) Users can search/list genes by a QTL ID.
Overlap with QTLs (by Gene) Genes could overlap with various numbers of QTLS. In this page, we list the genes and the numbers.
Blast lncRNAs among Species We blasted lncRNA transcript sequences among pig, chicken, cow, human and mouse.
Download
Data from the ALDB can be downloaded to perform local analysis. In the Download page, users can download lncRNAs in FASTA, GFF3 and GTF formats. They are divided per species and per content type, with information provided for the assembly of the species . We also provide the expression levels which we derived from the datasets ERA178851 and SRA059960. The FPKM (fragments per million reads per kb of transcript) expression levels were obtained by TopHat (with the parameter --no-novel-juncs) and Cufflinks (with the parameter -G). The count expression levels were generated by summaryOverlaps with the parameter mode="Union".
NOTE: Some files were compressed using tar. We can uncompress them with tar. For example, tar -zxvf ALDB.chicken.lincRNAs.v1.0.fa.tar.gz